
A finite element model is only useful if you can demonstrate that it is right. This Book Byte explains the difference between verification and validation, the three steps of the V&V process, the accuracy and mathematical checks to run on every model, and how to correlate an FEA with test data using a correlation plot.
What are verification and validation?
Verification, as defined by ASME (American Society of Mechanical Engineers): "The process of determining that a computational model accurately represents the underlying mathematical model and its solution."
Verify that:
- It works
- The math is right
- The FE analysis is accurate
Verification has nothing to do with reality: it is 100% related to the FEM itself.
Validation, as defined by ASME: "The process of determining the degree to which a model is an accurate representation of the real world from the perspective of the intended uses of the model."
Validate that:
- The FEA does what it is supposed to do
- The physics is right
- The FEA correlates with the test
Validation creates the bridge between the FEM and reality, to ensure that the real world is properly represented by the FEM.
The three steps of the V&V process
The first two steps remove modeling errors early in the FEA development process, while the third step focuses on comparison with experimental data:
- Accuracy checks, to ensure the model properly represents the physical system.
- Mathematical checks, to ensure the model is mathematically accurate. These checks do not confirm that the model represents a physical system; they confirm that the FEM is mathematically well-conditioned and does not introduce problematic mathematical artifacts.
- Validation (also called correlation), to ensure the model predicts the correct strains, stresses and behavior compared to the real physical and experimental behavior.
Accuracy checks
- Dimensions
- Element properties versus the digital mock-up (DMU)
- Units
- 2D/3D mesh quality
- Material properties
- Material orientation (for composite structures)
- Free edges and free faces
- Coincident nodes and elements
- Local coordinate systems
- Nodal coordinate systems
- Consistent shell normals
- Released degrees of freedom of 1D elements
- Mass
- Proper element use
- Duplicated elements and/or nodes
- Discontinuities
- MPCs, rigid elements and interpolation elements
- Beam element orientation and offsets
These checks are usually performed with your pre-processing software, the CAD and your engineering judgment. The details of each check are given in Table 16-1 (pages 374 to 376) of Chapter 16 of Practical Finite Element Analysis for Mechanical Engineers.
Mathematical checks
Mathematical checks reduce risks and ensure that your FEA is mathematically accurate and well-conditioned. They are performed with simple analyses such as modal analysis and static analysis. The typical mathematical checks are:
- Free-free modal analysis: rigid body and flexible mode check
- Unit gravity check
- Unit enforced displacement check
- Free thermal check
Correlation
An analysis is only as good as the test it correlates to.
- Correlation consists of checking FEA results against existing reference data.
- The analyses performed to size and validate structures are frequently supported by tests, and this experimental data can be used to check the FEA.
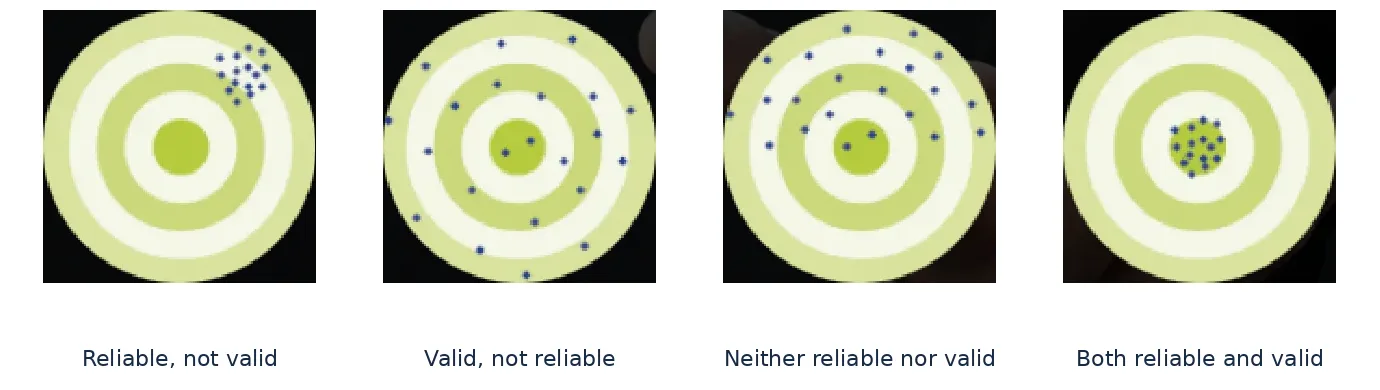
- Correlation demonstrates that the FEA is valid and reliable:
- Valid: the FEA predicts the correct strains and stresses.
- Reliable: the FEA predicts the correct behavior for ALL critical conditions.
The four stages of correlation
- Strain gauge measurements
- FEM strain extraction
- Validation factor calculation
- Creation of the correlation plot
Why the FEA and the test may not correlate
The main reasons for a poor correlation between the FEA and the test are:
- A geometrical and/or material mismatch between the test article and the FEA
- Local effects not captured by the FEA
- Gauge malfunctions
- Loading applied to the FEA that is not representative of the loading applied to the test article
- Incorrect boundary conditions
- Residual stresses not considered in the simulation
- Experimental errors
To identify the reasons for a lack of correlation, you need a very good knowledge of the test conditions. This information is usually given in the test reports published by the test teams.
The correlation plot
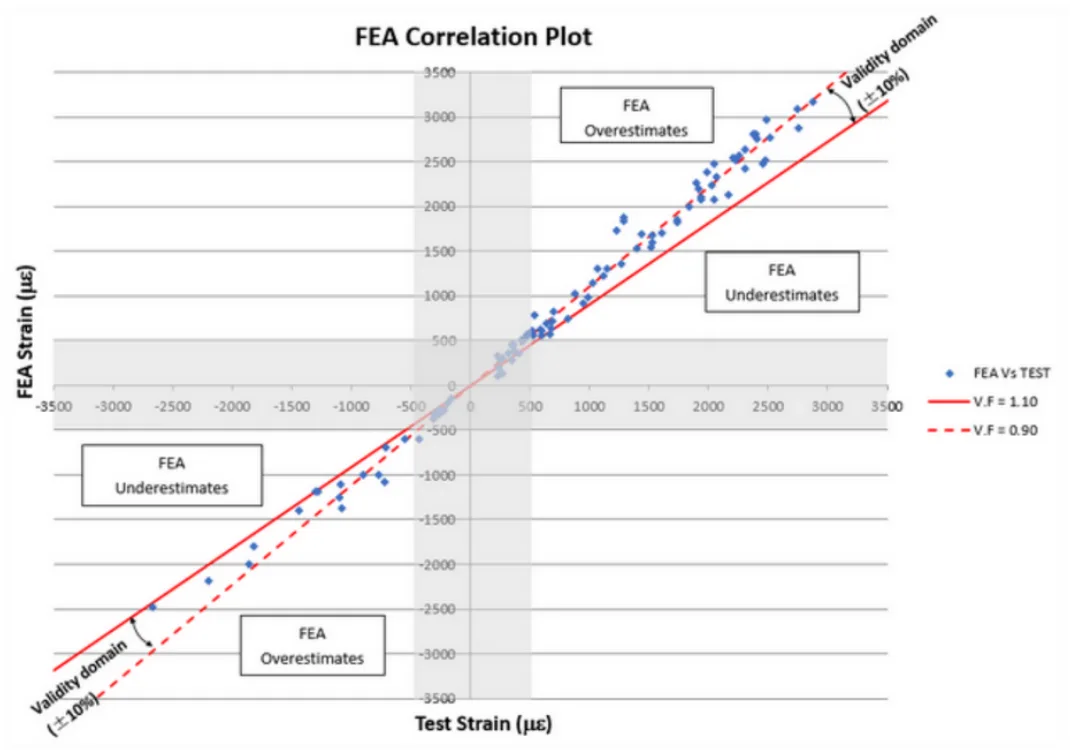
For each test article, produce a correlation plot showing the measured strains against the FEA strains. This graph captures, in a single view, the correlation level of an FEA with a test.
Each point represents a couple (εmeasured; εFEA) for a given load case and a given gauge at a specific location. The validity domain is bounded by validation factors of 0.90 and 1.10 (±10%): the more points within this domain, the more valid the model and the more confident we can be in the FEA results.
My checklist
My "FEM Checkout" Excel file is available to download for free in the Free Resources section. It is very useful to document your verification and validation, and to demonstrate to your client that you performed all the verifications.
Go further
This Book Byte is taken from Chapter 16 of Practical Finite Element Analysis for Mechanical Engineers by Dominique Madier. The topic is covered in depth, with worked examples, in the on-demand course Practical Basic FEA.
See the Practical Basic FEA course Take the free FEA diagnostic